The Myths of Pricey TVs - Don’t Get Tricked Into Paying the ‘Videophile Tax’


Most people look for great picture quality when buying a new TV, but chasing the absolute “best” picture quality can result in a price tag that’s thousands of dollars higher and a TV that isn’t noticeably better to the human eye.
The data scientists and economists at PerfectRec analyzed 262 popular TV models available from US retailers like Amazon and Best Buy, and identified the best and worst value TVs for picture quality.
A tale of diminishing returns
With TVs, you get what you pay for — up to a point. After about $1,300 for 65” TVs, the picture quality doesn’t improve much with price, and in some cases, it actually gets worse.
To find the sweet spot for the picture quality for your money, we looked at how the PerfectRec’s Picture Quality Score* related to price for 60-69” TVs. On the left side of the graph, the results aren’t that surprising. The cheapest TVs on the market don’t have great picture quality. As you spend more money, quality improves dramatically. But starting at the $1,000 mark, you start to see rapidly diminishing returns, meaning that each additional dollar you spend buys a smaller improvement in picture than the previous one. After $1,300, picture quality for 60-69" TVs stops improving with price.
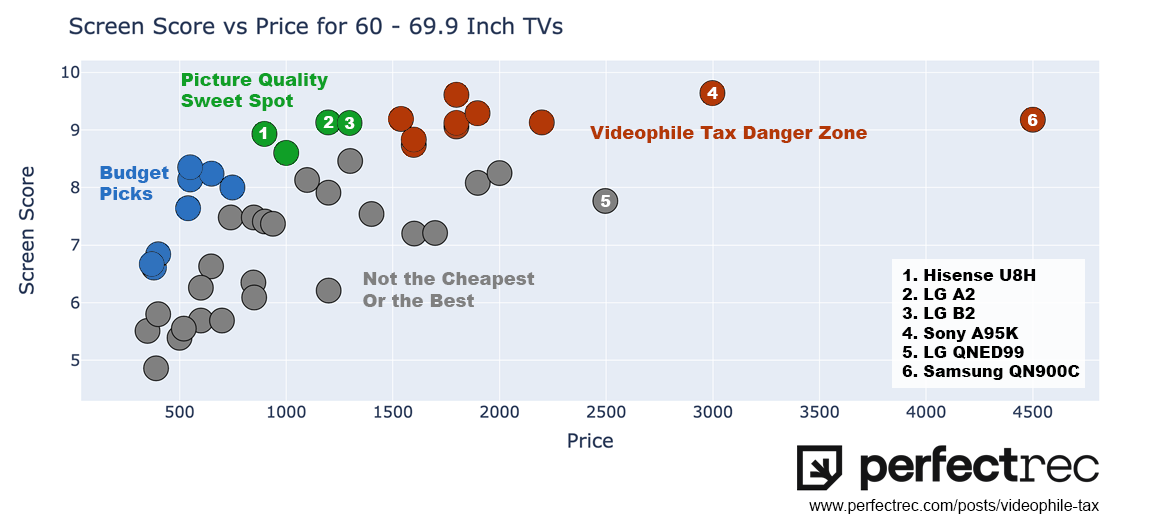
TVs in the chart above fall into three distinct categories
Budget Picks - These are the cheap TVs where you can get OK but not outstanding picture quality.
Picture Quality Sweet Spot - These are the TVs where you get outstanding picture quality at a still reasonable price. You face slightly diminishing returns on picture quality with these TVs, but they are probably where you want to shop if picture quality is important.
Videophile Tax Danger Zone - Some of these TVs have slightly better picture quality, some don't. But one thing they have in common is they are much more expensive than other options available.
Beware of the Videophile Tax: more expensive TVs doesn't always mean better picture quality
Our analysis found that in many cases you can end up paying hundreds or thousands of dollars more for a TV whose picture isn’t perceptibly better — or even better at all. We call this overpayment the “Videophile Tax.” Lots of consumers want to have “the best” picture quality, and manufacturers know they can charge a hefty premium for any TV marketed with that claim. But this is where you can really get into trouble as a consumer. “The surprising thing we found with TVs is that at the top of the market you have an explosion of price with very little, if any, improvement in picture quality,” said PerfectRec founder and CEO Joe Golden. “If having the most expensive TV on the market is important to you, go for it,” Golden says. “But just be aware that paying top dollar in the hopes of getting better picture quality is like expecting movie theater popcorn to taste better just because it costs more.”
Nowhere is the Videophile Tax more noticeable than with new technology. At the far right side of all our charts you can see the eye-wateringly expensive Samsung QN900C. This is Samsung’s flagship 8k TV and it retails for 3-4 times as much as TVs with similar screen quality scores. On top of that, there is very little 8k TV content available. So you’re likely to be paying top dollar for a 8K TV and end up just watching upscaled content on it.
The best value 65" TVs for picture quality
These aren’t the cheapest TVs, but they are the ones in the picture quality sweet spot where you maximize picture quality without unnecessary spending.
Name & Size | Price | Notes |
Hisense U8H - 65" | $898 | The Hisense U8H is one of the brightest, best looking and least expensive miniLED TVs in the market. While some people are still skeptical of the Hisense brand, the U8H is capable of all HDR formats and boasts exceptional HDR highlights. |
LG A2 - 65" | $1,197 | This is the least expensive OLED TV offering in the market at this size and has one of the best picture quality to price ratios in our database. |
LG B2 - 65" | $1,296 | This OLED TV is the perfect sweet spot in terms of picture quality and price. It features HDMI 2.1 and a 120HZ refresh rate, but still has an affordable sticker price. The B2 is one of our most recommended TVs for people who want great picture quality without breaking the bank. |
The three 65" TVs to avoid
You can spend a ton on these TVs but most people probably can’t notice the difference.
Name & Size | Price | Notes |
Sony A95K - 65" | $2,998 | The A95K is very similar to its direct competitor the Samsung S95B, but it can cost up to twice as much. |
LG QNED99 - 65" | $2,496 | While the LG QNED99 may come with a high price tag, it falls short of expectations in terms of picture quality. In most cases, it would be wise to opt for an OLED TV for superior performance. Alternatively, you could consider a comparably bright option such as the U8H or QN90B if you are watching it in a bright room. |
Samsung QN900C -65" | $4,499 | Samsung’s 2023 Flagship 8K LCD TV is very bright and impressive, but so is the jaw dropping price tag. At less than half the cost you can get last year's QN90B and still be amazed by the brightness and picture quality. |
Game of Thrones & Sunday Night Football
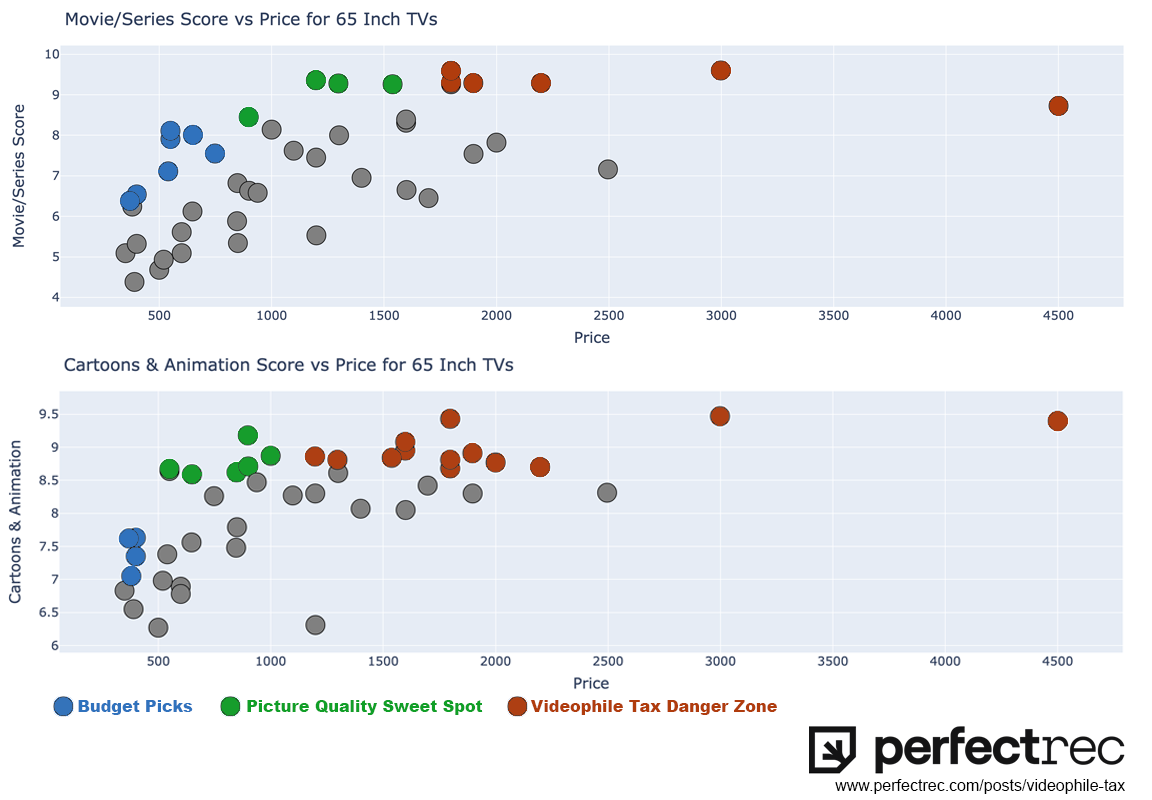
PerfectRec’s Picture Quality Score captures an overall image quality, but certain TVs perform better than others for different types of content. The best TV for watching prestige TV like Game of Thrones and Succession–we’d recommend the LG B2 for its deep blacks and OLED screen– is different from what you’d pick if you spend every evening watching Frozen with the kids–get a Hisense U8H for its great colors and affordable price.
In order to capture those differences, PerfectRec has developed specialized scores for different content types. For movies and cinematic TV, we look at factors like color gamut and black uniformity. But for sports, we focus more on screen response time and gray uniformity to make sure colors are uniform across the pitch. Our full list of specialized content scores includes:
Movies & cinematic TV
Sports
Video games
News, talk, & other TV
Cartoons & animation
We took a look at how all of those scores interacted with price and found a similar pattern: The best TVs for each content type are not necessarily the most expensive. Here’s a look at how the charts for PefectRec's Movies & Cinematic TV and Cartoons & Animation scores compare. You can see the same overall trend, but the shape of the distribution is a bit different. The picture quality sweet spot for cartoons comes at under $1,000 for 60-69" TVs while for movies the sweat spot is around $1,500. This is due to the fact that the more expensive OLED TVs do more to enhance the movie experience than they do for cartoons and animation.
What about bigger TVs?
We based our analysis on 60-69” TVs, since that covers many of the best-selling sizes. However we also looked at if the Videophile Tax trend held for larger TVs. It does. Here are the 33 75” TVs in our database.
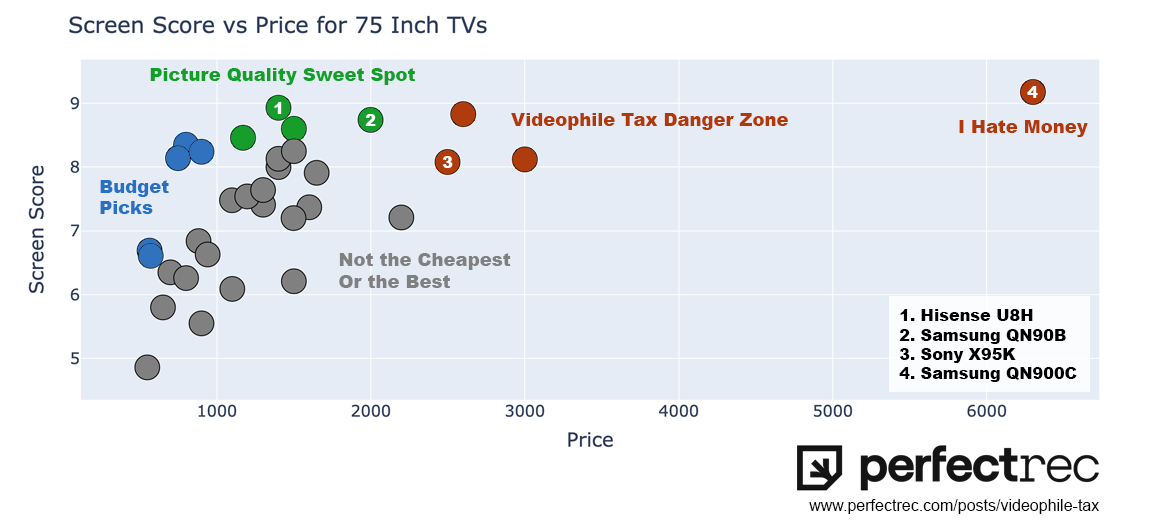
The best value pics for 75” TVs
Name & Size | Price | Notes |
Hisense U8H - 75" | $1,399
| The 75" U8H model offers incredible value for your money, especially if you're watching the latest HDR content. It stands out as one of the best options available for the budget conscious. |
Samsung QN90B -75" | $1,997 | If you are looking for a big and bright TV and OLEDs are simply too expensive, this should be your starting point. This TV has all the latest gaming features, very good sound and a picture quality that makes all other LCD TVs pale in comparison. |
And the 75” TVs to avoid
Name & Size | Price | Notes |
Sony X95K - 75" | $2,498 | Sony’s flagship LCD TV is a bright and very capable set, but its hefty price tag makes it tough to recommend for most users. If looking for a TV just as bright, consider the QN90B, or for superior picture quality you might want to look at the LG C2 or the Sony A80K. |
Samsung QM900C -75" | $6,299 | Samsung's flagship 8K TV comes with a notably high price tag, just slightly surpassing its last year 4K sibling, the QN90B. It's important to consider that 8K content is currently scarce, which means you'll be investing more in a feature that you'll seldom utilize, as most of your content will need to be upscaled. |
Methodology
We analyzed 262 popular TVs that are available in the US market.
Our analysis included TVs from the following brands: Amazon, Hisense, Insignia, LG, Samsung, Sony, TCL, and Vizio.
Price is the lowest US retail price available as of June 5th, 2023 according to PerfectRec scraping of major national retailers like Amazon, Walmart and Best Buy as well as manufacturer websites.
About PerfectRec’s Picture Quality and Content Scores:
*Picture Quality Score - PerfectRec developed this proprietary score designed to provide an overall assessment of a display's visual performance. It is a comprehensive metric that takes into account eight quantitative measures of picture quality, including: contrast ratio, color gamut, color volume, local dimming, gray uniformity, black uniformity, viewing angle, reflections (glare) and color calibration. By combining multiple factors, this score offers a more nuanced and comprehensive evaluation of a display's capabilities than a single factor. Contrast is crucial to our visual experience since humans are better at distinguishing bright and dark scenes than color hues. Color Gamut and Color Volume measure color accuracy and how well colors can be maintained throughout the brightness range. Local dimming and black uniformity are essential for inky blacks and black scenes, while gray uniformity, viewing angles, and reflections for certain content like sports.
Movies & Cinematic TV Score - PerfectRec’s movies & cinematic TV score takes into account the most important TV features for cinematic content. Our score considers the following factors: color accuracy (including color gamut, color volume, and out-of-the-box colors), as well as local dimming and black uniformity. We also factor in gray uniformity and viewing angles to a lesser degree.
Sports Score - PerfectRec’s sports score prioritizes response time as the most important factor to ensure clear images of fast-moving scenes. In addition, we consider gray uniformity, which ensures that the turf looks the same across the whole screen, reflections, to avoid distracting ambient light from the action, and viewing angles, to avoid color distortion and washed-out images, especially when not seated directly in front of the TV.
Gaming Score - PerfectRec’s gaming score measures a TV's performance when it comes to playing video games. It is based on several factors that can significantly impact the quality of the gaming experience, including screen response time (30%), input lag (30%), and refresh rate (30%). Screen response time is a critical factor that determines how quickly the TV can transition from one frame to the next, while input lag measures the delay between the gaming console output and the TV display. Refresh rate refers to the number of times per second that the TV displays a new frame, which can impact the smoothness of the gaming experience. The gaming score also takes into account two other features: local dimming in gaming mode (7%), which can enhance contrast and picture quality, and black frame insertion (3%), which can reduce screen brightness and create a smoother gaming experience.
Cartoons & Animation Score - PerfectRec’s cartoons & animation score places great importance on several crucial aspects of TV picture quality, such as color gamut, color volume, and out-of-the-box colors, in addition to good gray uniformity and contrast, to ensure that you can fully enjoy your favorite animated content. Cartoons and animation are characterized by vibrant and colorful imagery, however, accurately displaying this type of content can pose a challenge for TVs, particularly during scenes with complex lighting or subtle color variations.
News, Talk, & Other TV Score - PerfectRec’s news, talk, & other TV score prioritizes upscaling, brightness, contrast, colors out of the box, and screen uniformity. This is because almost all news and talk shows are created using Standard Dynamic Range (SDR) with lower resolutions, such as 720P and 1080P. The purpose of this prioritization is to ensure that lower resolution content looks good on a 4K display and to help you identify which TV will perform best when watching live TV via Cable, Satellite, or Antenna.
Contact
For any inquiries, contact Wally Nowinski - wally@perfectrec.com
Other recommended articles

Samsung Galaxy S24 Customer Satisfaction Tracker
Samsung’s Galaxy S24 lineup tops the iPhone in customer satisfaction for the first time
45% of the reviews at the Oakland In-N-Out in 2023 mentioned being robbed

MAP - The gas stations where tourists are regularly robbed near Oakland International Airport
Stay up to date on new products
Get occasional updates about new product releases, interesting product news, and exciting PerfectRec features. No spam. We never share your email.